


Plant Phenotyping Market Research,2034
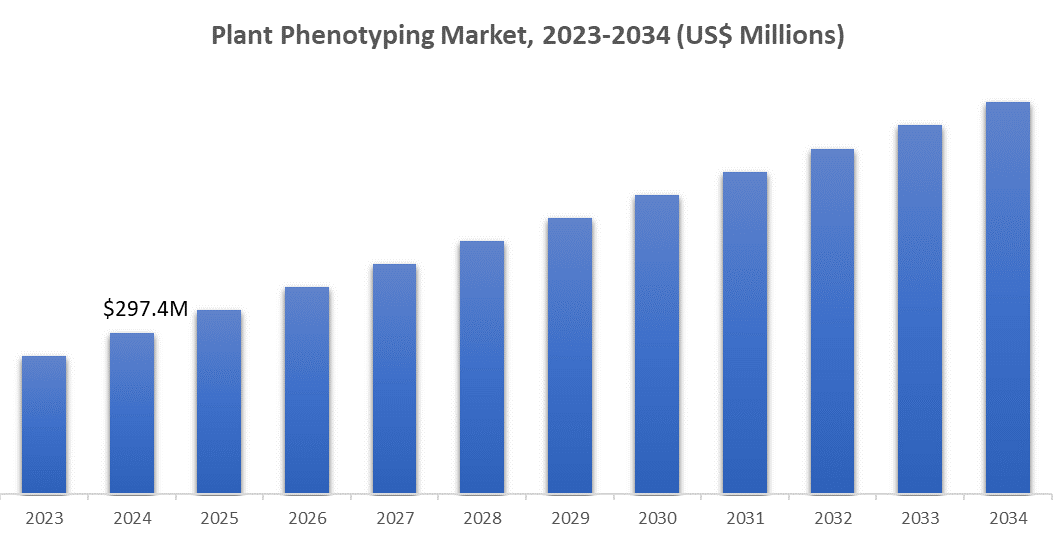
The global plant phenotyping market is anticipated to grow at a CAGR of 12.4% in the forecast period (2024-2034), with the market size valued at US$ 265 million in 2023 and projected to reach US$ 960.2 million by 2034.
Plant phenotyping involves the quantitative analysis of plant characteristics such as growth, physiology, and productivity to comprehend how genetic and environmental elements affect plant performance. It involves utilizing tools and techniques to evaluate features such as morphology, photosynthetic efficiency, stress responses, and yield traits.
These assessments are performed using imaging technologies, sensors, and data analysis, providing critical insights for plant breeding, crop enhancement, and sustainability. Plant phenotyping is essential for creating stress-resistant, high-yield, and climate-adaptive crops, tackling issues related to rising global food needs and environmental shifts. This multidisciplinary area combines biology, engineering, and data science, rendering it essential for enhancing agriculture and securing food in an evolving environment.
Market Highlights
The market is driven by the rising demand for enhanced crop yield to satisfy global food demands. The increase in climate change and the demand for stress-resistant crops have hastened research in plant phenotyping to create resilient agricultural solutions. Improvements in imaging, sensor technology, and artificial intelligence facilitate accurate trait analysis, promoting uptake among research organizations and agro-tech firms.
The movement towards precision agriculture boosts market growth as farmers adopt phenotyping technologies to improve their decision-making. Moreover, government programs and financial support for sustainable farming and plant studies promote market expansion. Looking ahead, there will be a higher demand from developing nations for innovative farming techniques to tackle food security issues in the industry.
Market Segmentation
Equipment plays a dominant role due to its vital importance in high-throughput and precise phenotypic analysis
The market is divided by Type into Equipment, Sensors, and Software. Equipment largely influences the market since it facilitates high-throughput and accurate phenotypic analysis. This segment encompasses imaging technologies (multispectral, hyperspectral, and thermal cameras), automated systems, and drones, which are crucial for obtaining detailed plant characteristics.
Imaging systems are commonly utilized for their capacity to deliver real-time, high-resolution information about plant morphology, photosynthesis, and stress reactions. Automated systems and drones improve scalability, enabling efficient phenotyping over extensive regions. Technological advancements, including AI integration and 3D imaging tools, have greatly enhanced the efficiency and precision of equipment, making it essential for plant research, breeding initiatives, and precision agriculture.
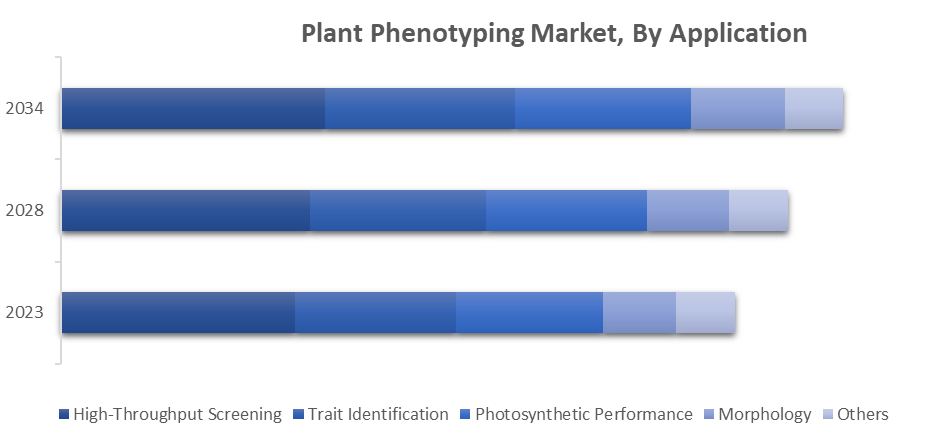
High-throughput screening is expected to lead the market due to its fast and large-scale analysis of plant traits
The market is divided by Application into High-Throughput Screening, Trait Identification, Photosynthetic Performance, Morphology, and Others. High-throughput screening prevails since it enables quick and extensive examination of plant characteristics. Scientists and farming enterprises utilize high-throughput systems to examine thousands of plants effectively, allowing for swift recognition of beneficial features like drought resistance, nutrient absorption, and yield capability.
This application is vital in crop breeding initiatives, where precision and rapidity are crucial for creating high-yielding and stress-resistant crops. High-throughput phenotyping combines automated imaging technologies, robotics, and advanced sensors, delivering extensive data that speeds up decision-making. The use of this technology has expanded markedly because of the rising demand for food security, precision farming, and enhanced crop yields in the face of climate issues.
Market Dynamics
Growth Drivers
Need for Improved Crop Yields to Fuel Market Expansion
The ever-rising global population has increased food demand, forcing agriculture to enhance crop yields significantly. Plant phenotyping technologies are essential for recognizing high-yield and resilient crop varieties, enhancing efficiency in breeding initiatives. Phenotyping aids in tackling issues such as climate change, soil degradation, and restricted arable land by facilitating a thorough examination of plant characteristics across different environmental settings.
This technology aids precision farming, guaranteeing improved resource management and enhanced production. Government programs and funding in agricultural research also promote adoption. Moreover, phenotyping instruments are essential for creating stress-resistant crops, securing enduring food security and sustainability while satisfying the increasing need for quality products.
Advances in Imaging and Sensor Technologies are Expected to Create New Market Growth Opportunities
Rapid Development in imaging and sensor technologies has remarkably enhanced the precision and scalability of plant phenotyping methods. Multispectral, hyperspectral, and thermal imaging technologies can gather complex plant characteristics, including morphology, photosynthetic performance, and stress responses. When paired with advanced sensors, these instruments enable real-time data gathering in various agricultural settings.
Advanced technologies such as 3D imaging, drones, and artificial intelligence enhance data processing and trait recognition. These technologies facilitate high-throughput screening, assisting researchers in precisely analyzing extensive datasets. Their adoption facilitates in creation of climate-resilient crops and enhances resource efficiency. With the decline in imaging and sensor expenses, these technologies are increasingly available to a wider array of agricultural participants.
Restraints
High Cost of Advanced Phenotyping Systems May Restrict Comprehensive Market Growth
The expensive nature of sophisticated plant phenotyping systems continues to be a major obstacle to market acceptance, especially in emerging areas. Cutting-edge devices, including automated imaging systems, drones, and AI-enhanced tools, demand significant upfront investment and continuous maintenance expenses. Furthermore, the intricacy of these systems requires experienced individuals, raising operational costs.
Numerous research organizations, small farms, and developing agricultural economies find it challenging to designate adequate budgets for phenotyping technologies. Restricted funding options and elevated operational expenses also hinder adoption, especially for small and medium-sized enterprises (SMEs). To overcome this limitation, we need enhanced affordability, government support, and creative leasing or partnership strategies to ensure advanced phenotyping is available to a broader audience.
Recent Developments
- LemnaTec GmbH has launched a new AI-powered phenotyping platform for automated trait identification. The company has partnered with a European agricultural research center to develop high-throughput plant imaging systems.
- KeyGene N.V. has developed a precision trait discovery tool that integrates genotyping with phenotyping for faster crop improvement. The company has formed a collaboration with major seed companies to improve phenotyping for climate-resilient crops.
- Heinz Walz GmbH has expanded its portable phenotyping solutions for field-based research. The corporation has launched a photosynthesis monitoring system for high-resolution plant stress analysis.
- Phenospex B.V. has released a new generation of 3D plant scanners for high-throughput phenotyping. The company has partnered with greenhouse automation companies to integrate phenotyping into controlled environment agriculture.
- WPS B.V. has unveiled a modular phenotyping solution designed for custom greenhouse setups.
Key Players
- LemnaTec GmbH
- KeyGene N.V.
- Heinz Walz GmbH
- Phenospex B.V.
- WPS B.V.
- Photon Systems Instruments (PSI)
- Delta-T Devices Ltd.
- Qubit Systems Inc.
- CropDesign (BASF Plant Science)
- WinField United (Land O’Lakes)
- Thermo Fisher Scientific
- Li-Cor Biosciences
- Lemnatec – Fraunhofer Alliance
- IBM Research
- AgroTech A/S
- Other Prominent Players (Company Overview, Business Strategy, Key Product Offerings, Financial Performance, Key Performance Indicators, Risk Analysis, Recent Development, Regional Presence, SWOT Analysis)
Regional Analysis
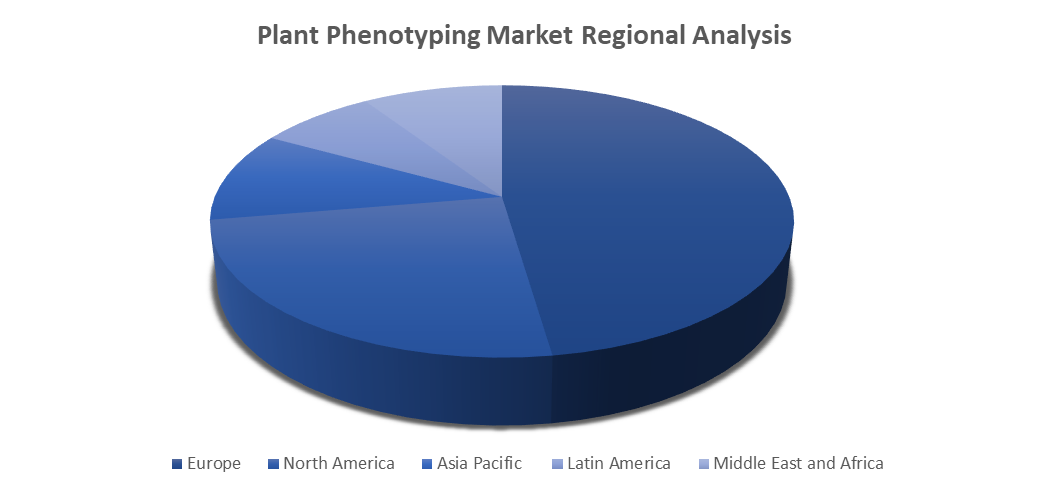
The Global plant phenotyping market is segmented based on regional analysis into five major regions: North America, Latin America, Europe, Asia Pacific, and the Middle East and Africa.
Europe leads the market owing to its strong research infrastructure, substantial investment in agro-biotechnology, and solid government backing for sustainable farming. Nations such as Germany, France, and the Netherlands are at the forefront of implementing advanced phenotyping systems, with universities and research institutes fostering innovation. The European Union's emphasis on climate resilience and minimizing agricultural environmental effects drives market expansion. Joint initiatives among governments, research institutions, and private entities establish Europe as the center for phenotyping technologies.
North America, although developed, lags a bit behind Europe due to reduced government involvement but gains advantages from private-sector funding and corporate-led R&D in phenotyping.
The Asia-Pacific region is a developing market, fueled by agricultural growth and the demand for food security, with nations such as China and India allocating resources to phenotyping technologies.
Latin America, the Middle East & Africa experience slower growth because of inadequate research infrastructure and funding, yet they possess potential as awareness and government backing grow.
Market is further segmented by region into:
- North America Market Size, Share, Trends, Opportunities, Y-o-Y Growth, CAGR – United States and Canada
- Latin America Market Size, Share, Trends, Opportunities, Y-o-Y Growth, CAGR – Mexico, Argentina, Brazil, and Rest of Latin America
- Europe Market Size, Share, Trends, Opportunities, Y-o-Y Growth, CAGR – United Kingdom, France, Germany, Italy, Spain, Belgium, Hungary, Luxembourg, Netherlands, Poland, NORDIC, Russia, Turkey, and Rest of Europe
- Asia Pacific Market Size, Share, Trends, Opportunities, Y-o-Y Growth, CAGR – India, China, South Korea, Japan, Malaysia, Indonesia, New Zealand, Australia, and Rest of APAC
- Middle East and Africa Market Size, Share, Trends, Opportunities, Y-o-Y Growth, CAGR – North Africa, Israel, GCC, South Africa, and Rest of MENA
Market Scope and Segments
|
ATTRIBUTE |
DETAILS |
|
Study Period |
2018-2034 |
|
Base Year |
2023 |
|
Forecast Period |
2024-2034 |
|
Historical Period |
2019-2022 |
|
Growth Rate |
CAGR of 12.4% from 2024-2034 |
|
Unit |
Value (US$ Million) |
|
Segmentation |
Main Segments List |
|
By Type |
|
|
By Application |
|
|
By End User
|
|
|
By Region |
|
Frequently Asked Questions (FAQ):
The global plant phenotyping market size was valued at US$ 265 million in 2023 and is projected to reach the value of US$ 960.2 million in 2034, exhibiting a CAGR of 12.4% during the forecast period.
The market involves the use of advanced technologies, such as imaging, sensors, and automation, to analyze and measure plant traits, including growth, development, and responses to environmental conditions. This market supports crop improvement, agriculture, and plant research.
The Equipment and High-Throughput Screening segment accounted for the largest Market share.
Key players in the plant phenotyping market include LemnaTec GmbH, KeyGene N.V., Heinz Walz GmbH, Phenospex B.V., WPS B.V., Photon Systems Instruments (PSI), Delta-T Devices Ltd., Qubit Systems Inc., CropDesign (BASF Plant Science), WinField United (Land O’Lakes), Thermo Fisher Scientific, Li-Cor Biosciences, Lemnatec – Fraunhofer Alliance, IBM Research, AgroTech A/S. and Other Prominent Players.
The market is propelled by elements such as rising demand for crop quality and yield, progress in sensing and imaging technologies, and heightened investments in agricultural R&D.
 Select License Type
